
Last modified: 03 Mar 2025
History of R
Notable uses
- Facebook,
- google,
- Microsoft (who recently invested in a commerical provider of R)
- The New York Times.
- Buzzfeed use R for some of their serious articles and have made the code publically available
- The New Zealand Tourist Board have R running in the background of their website
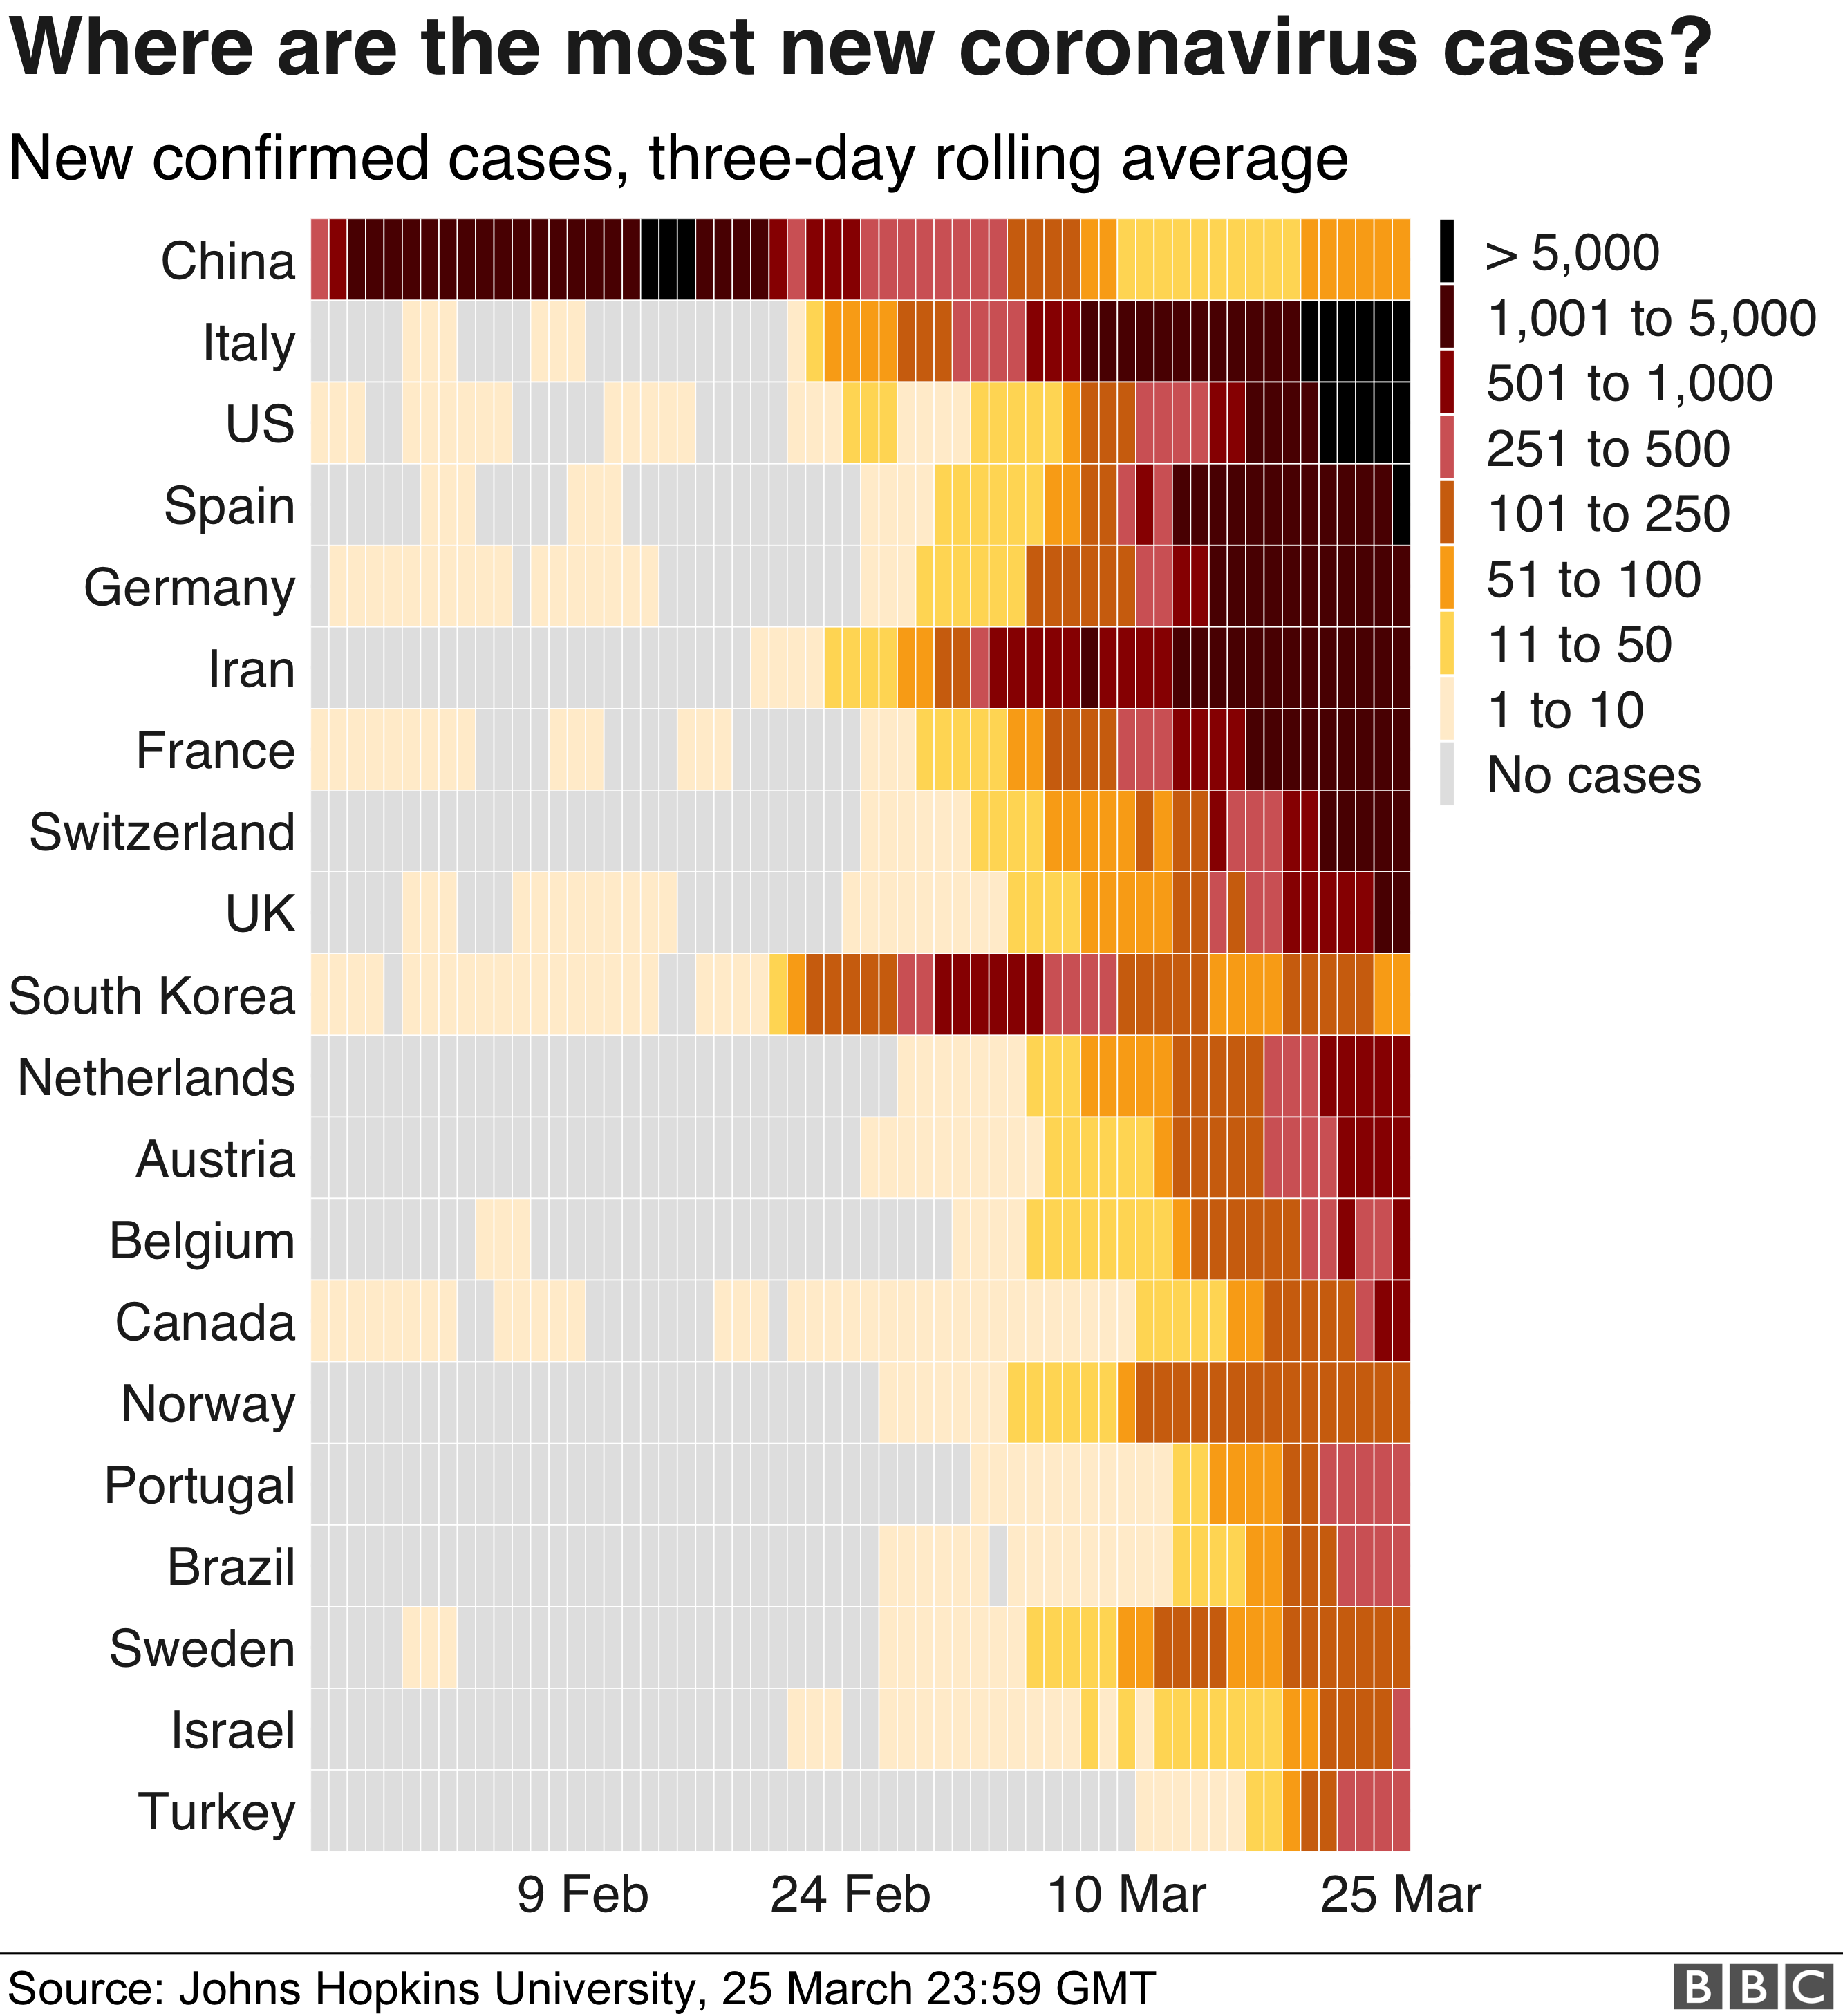
- The BBC makes code available for some of their stories (e.g. gender bias in music festivals)
- Airbnb
A relevant example
Topics covered
- The Rstudio environment
- Reproducible Reporting
- Importing data from a spreadsheet
- Filtering Data
- Plotting and customisation of plots
- Calculating numerical summaries
- Joining data from multiple spreadsheets
Packages covered
- We will cover a very small set of packages - the tidyverse
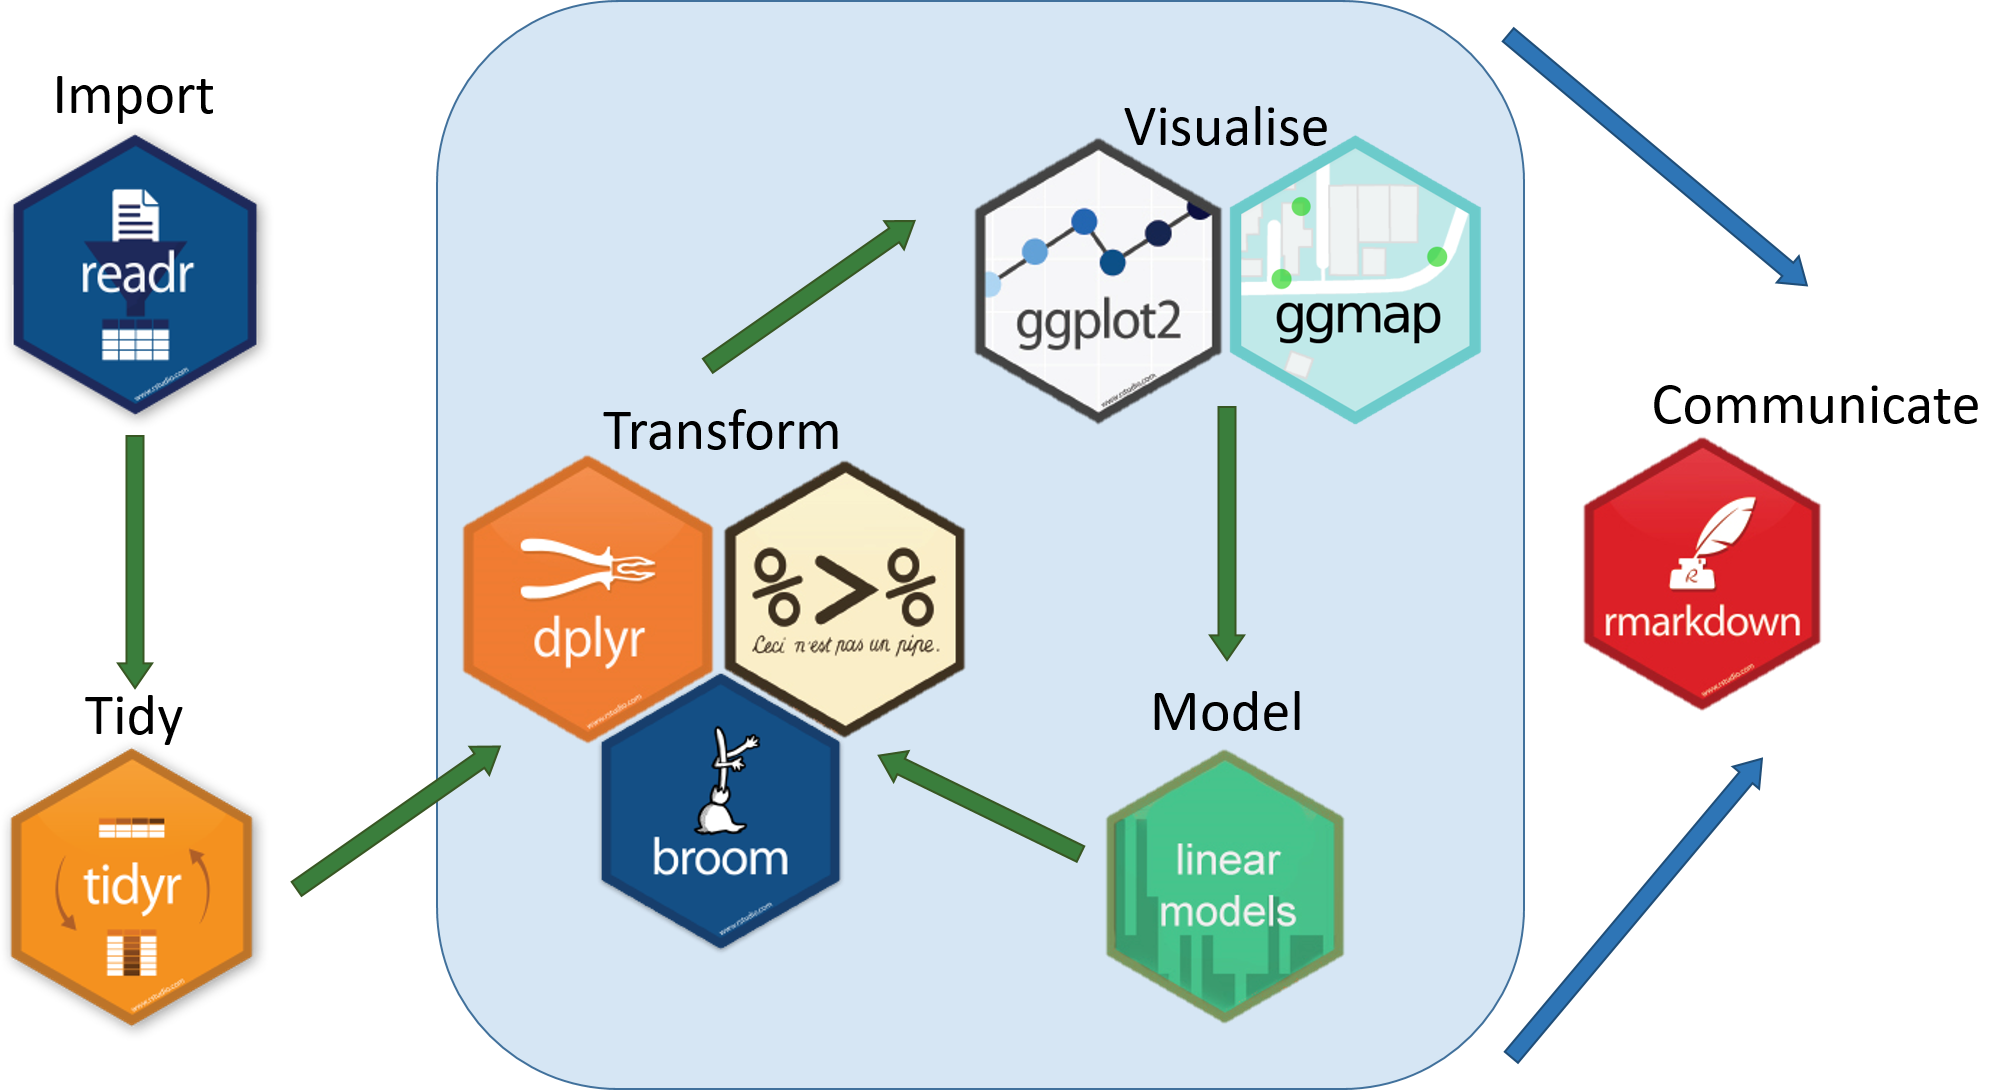
Image Credit: Aberdeen Study Group
Can’t we just do these things in Excel?
- Spreadsheets are a common entry point for many types of analysis and Excel is used widely but
- can be unwieldy and difficult to deal with large amounts of data
- error prone (e.g. gene symbols turning into dates)
- tedious and time consuming to repeatedly process multiple files
- how can you, or someone else, repeat what you did several months or years down the line?
Facilitating reproducible research
Course Data

- We will use data from the gapminder project
Example plots
- By the end of the course we will be creating plots like this in a few lines of code

Example plots

Course Outline
- Session 1:- RStudio and R basis, Reading data into R
- Session 2:- Data manipulation and plotting
- Session 3:- Further plotting, Summarising, joining tables and open-ended practice
Resources
Thanks
- Materials at https://sbc.shef.ac.uk/training/r-online/
- Find this useful? Tell your colleagues and mention us on twitter
@SheffBioinfCore